
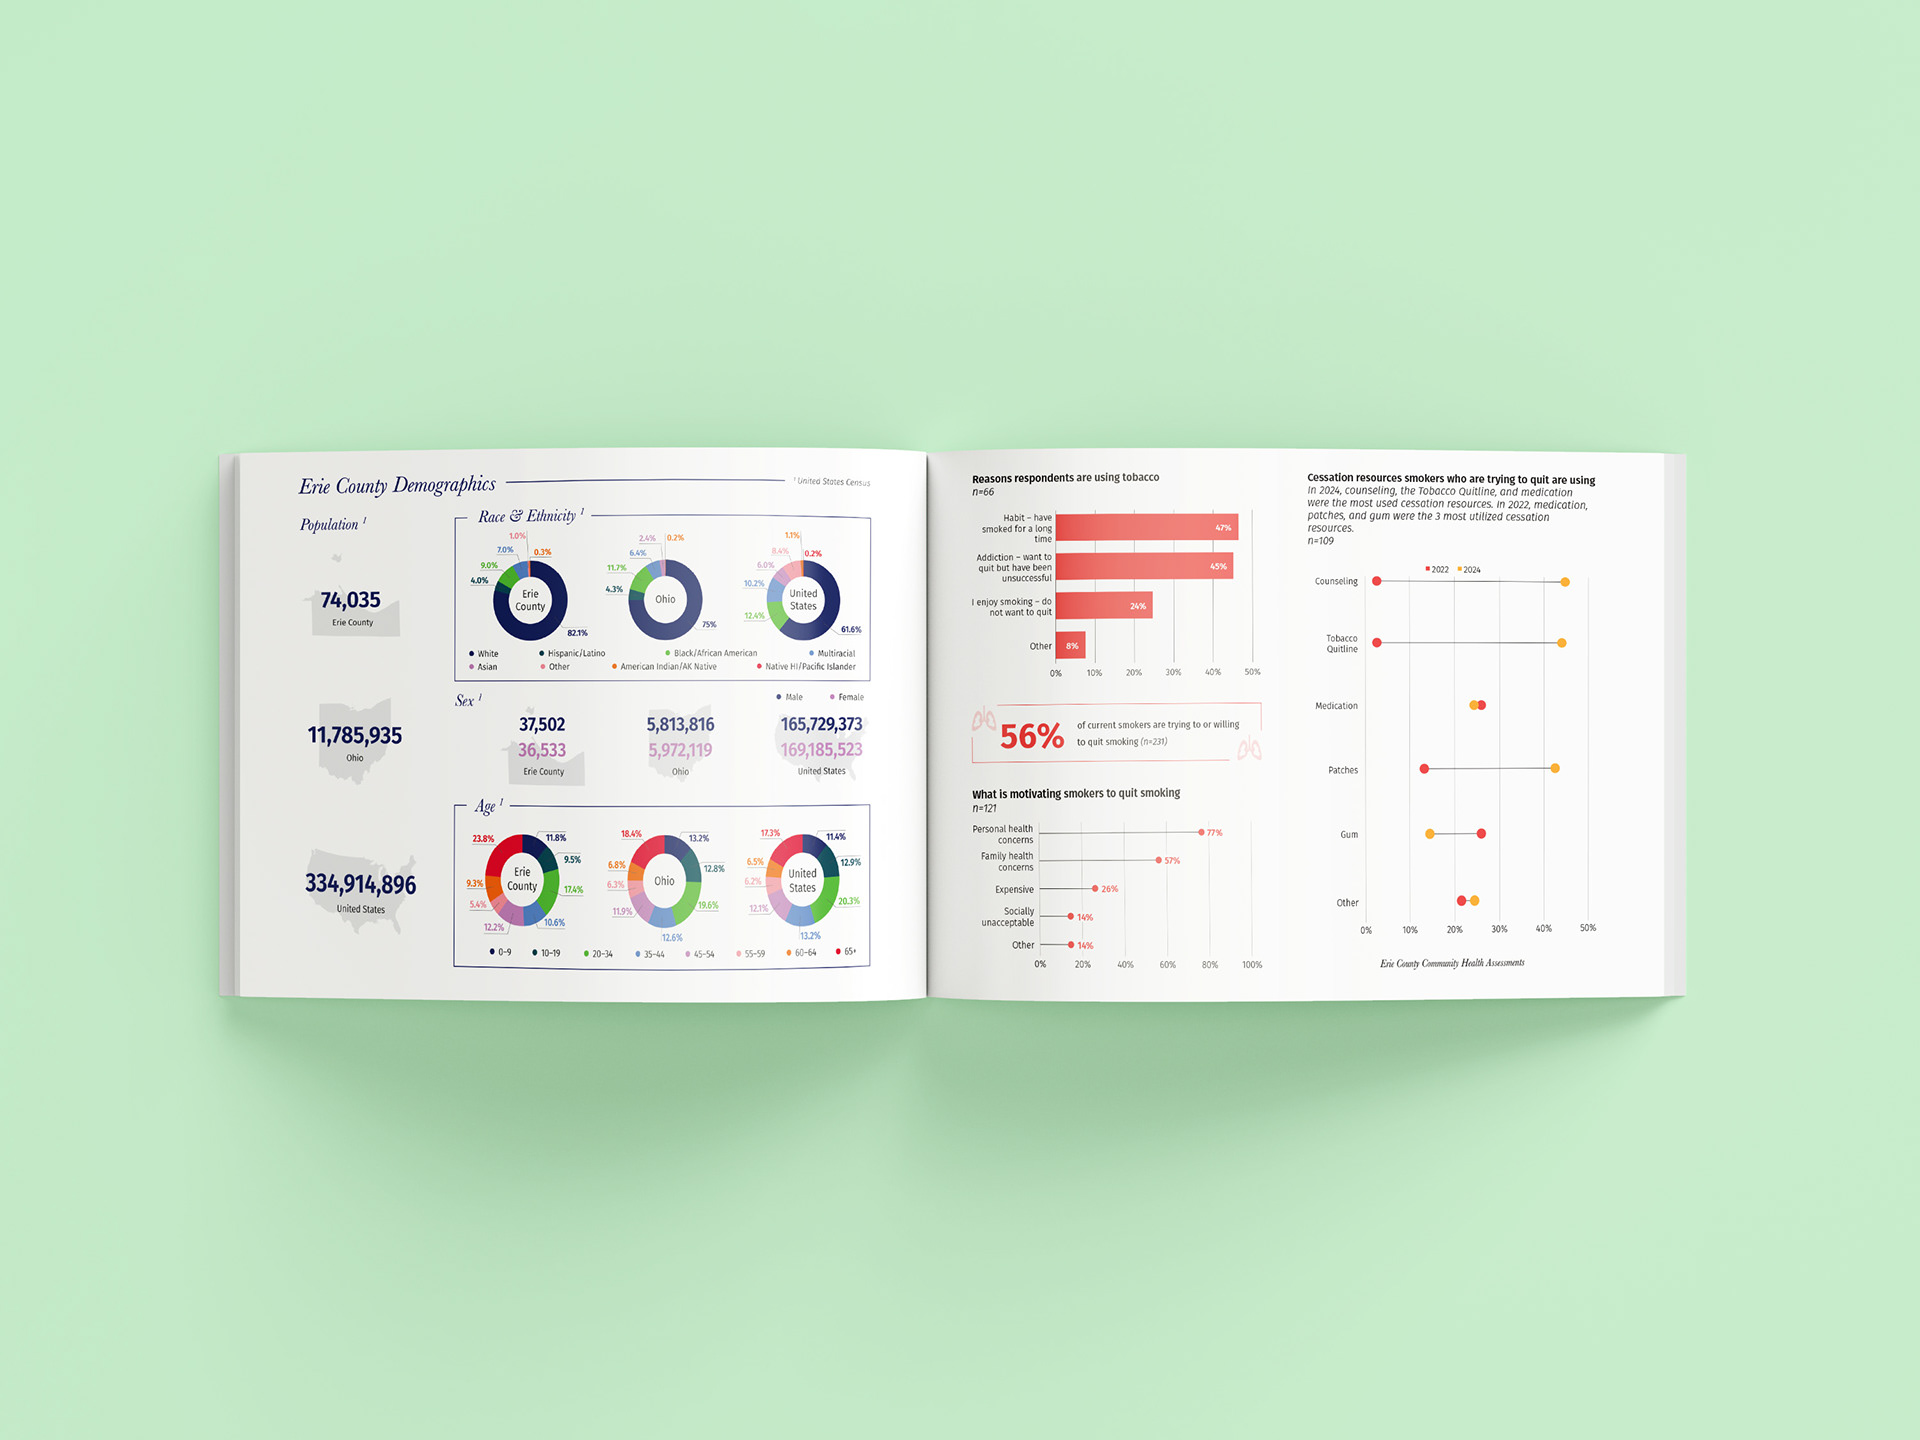
As part of a larger effort to improve the health of communities, our team took on the work to conduct a community health assessment for Erie County in Ohio. With such a large quantity of data to express, this is where my job came in.
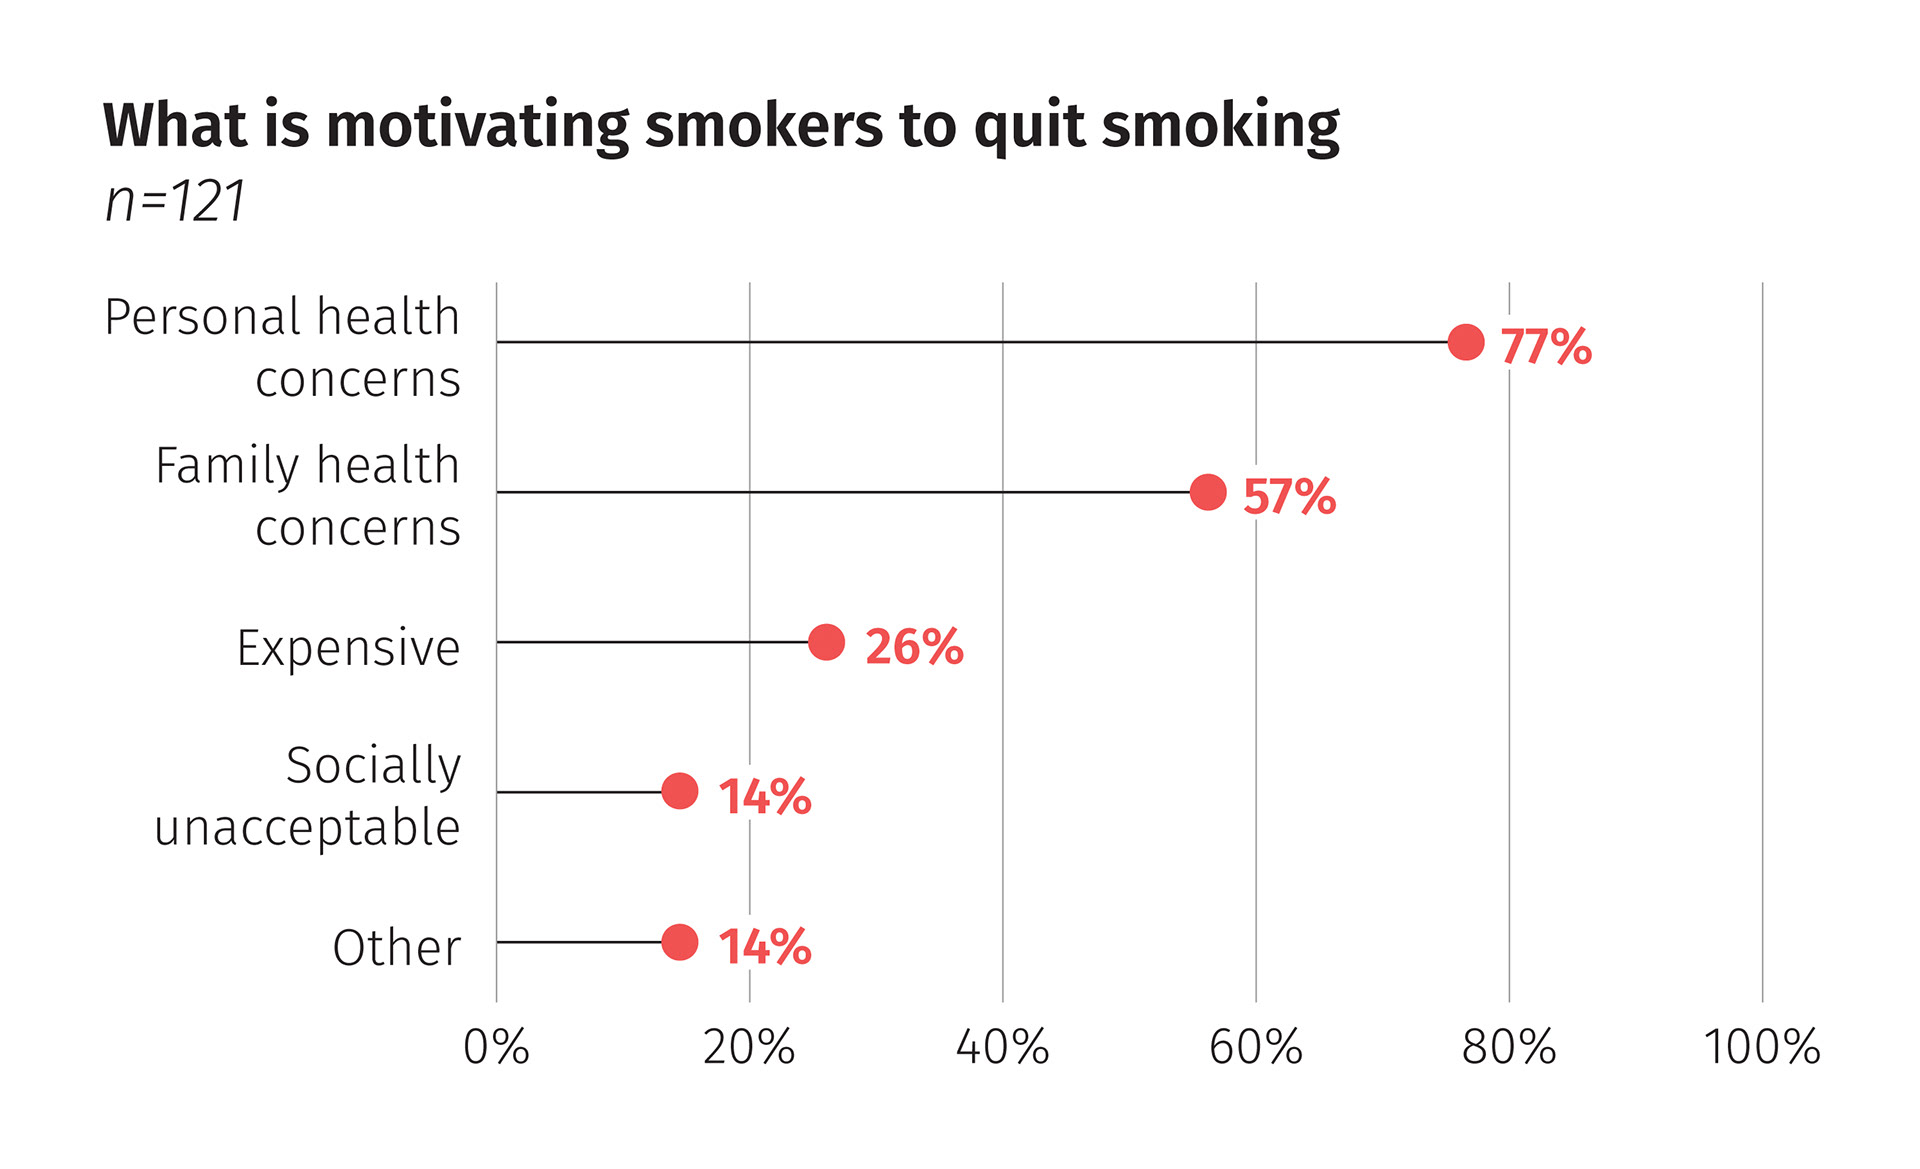
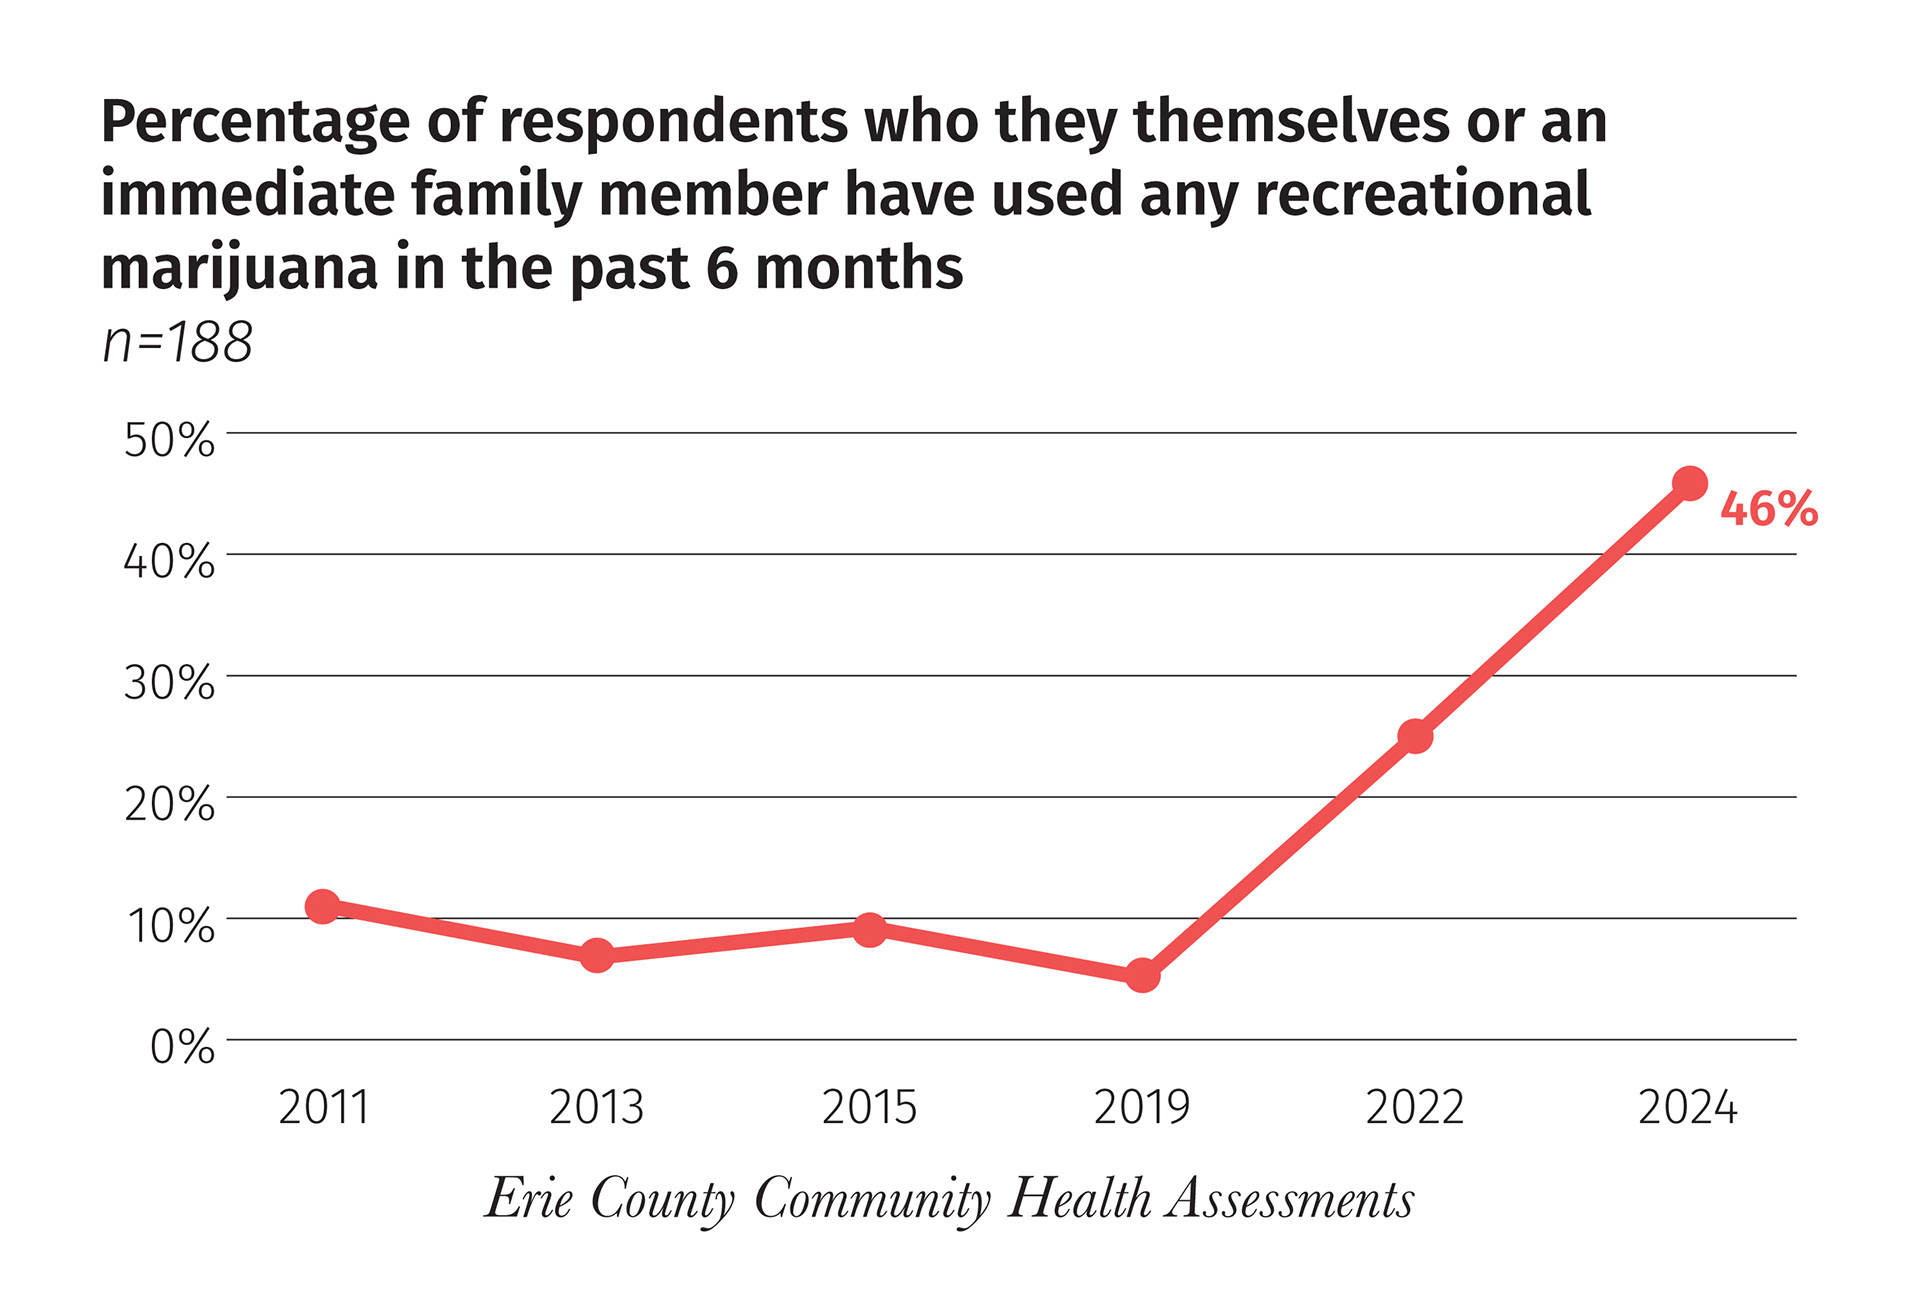
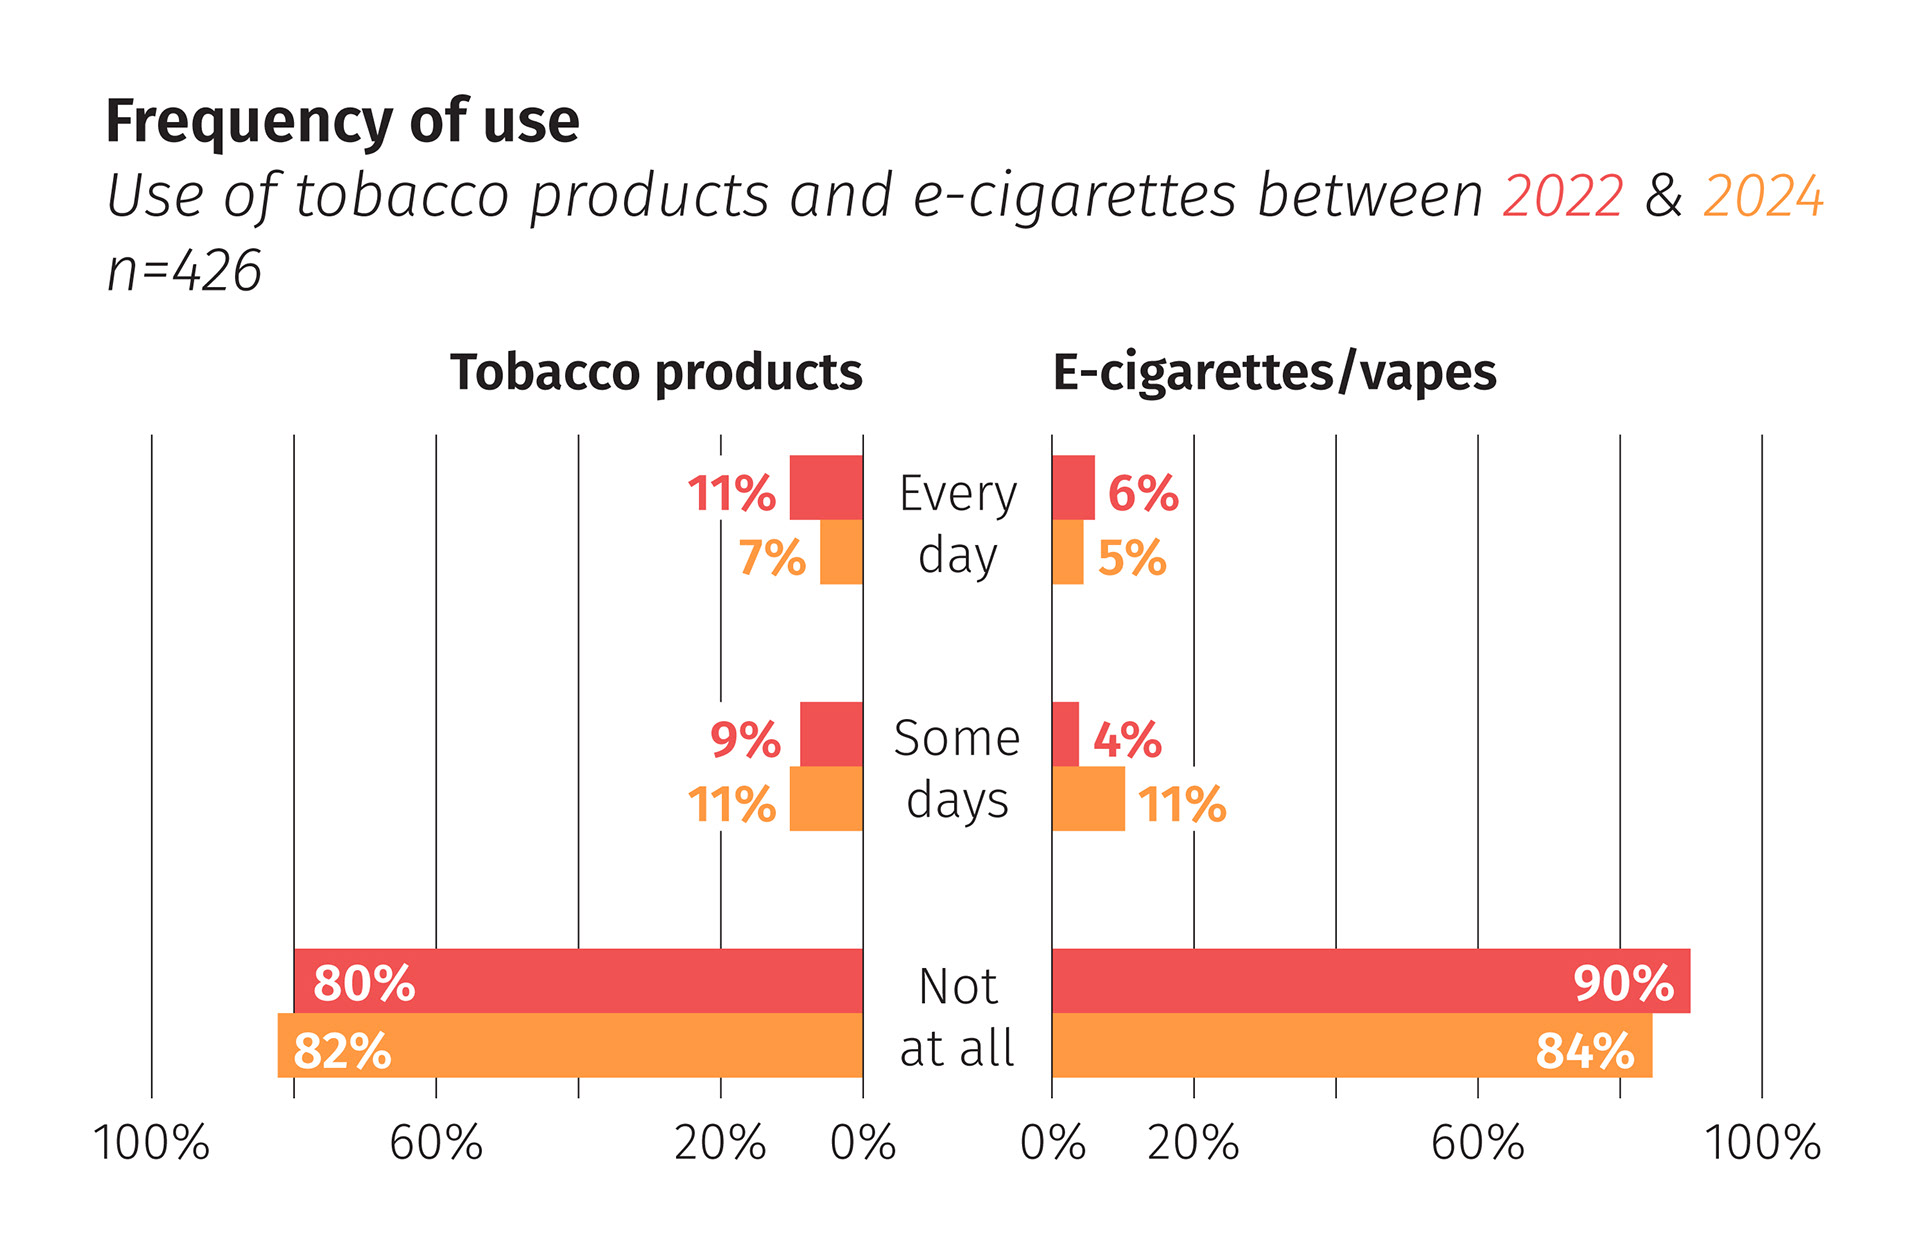
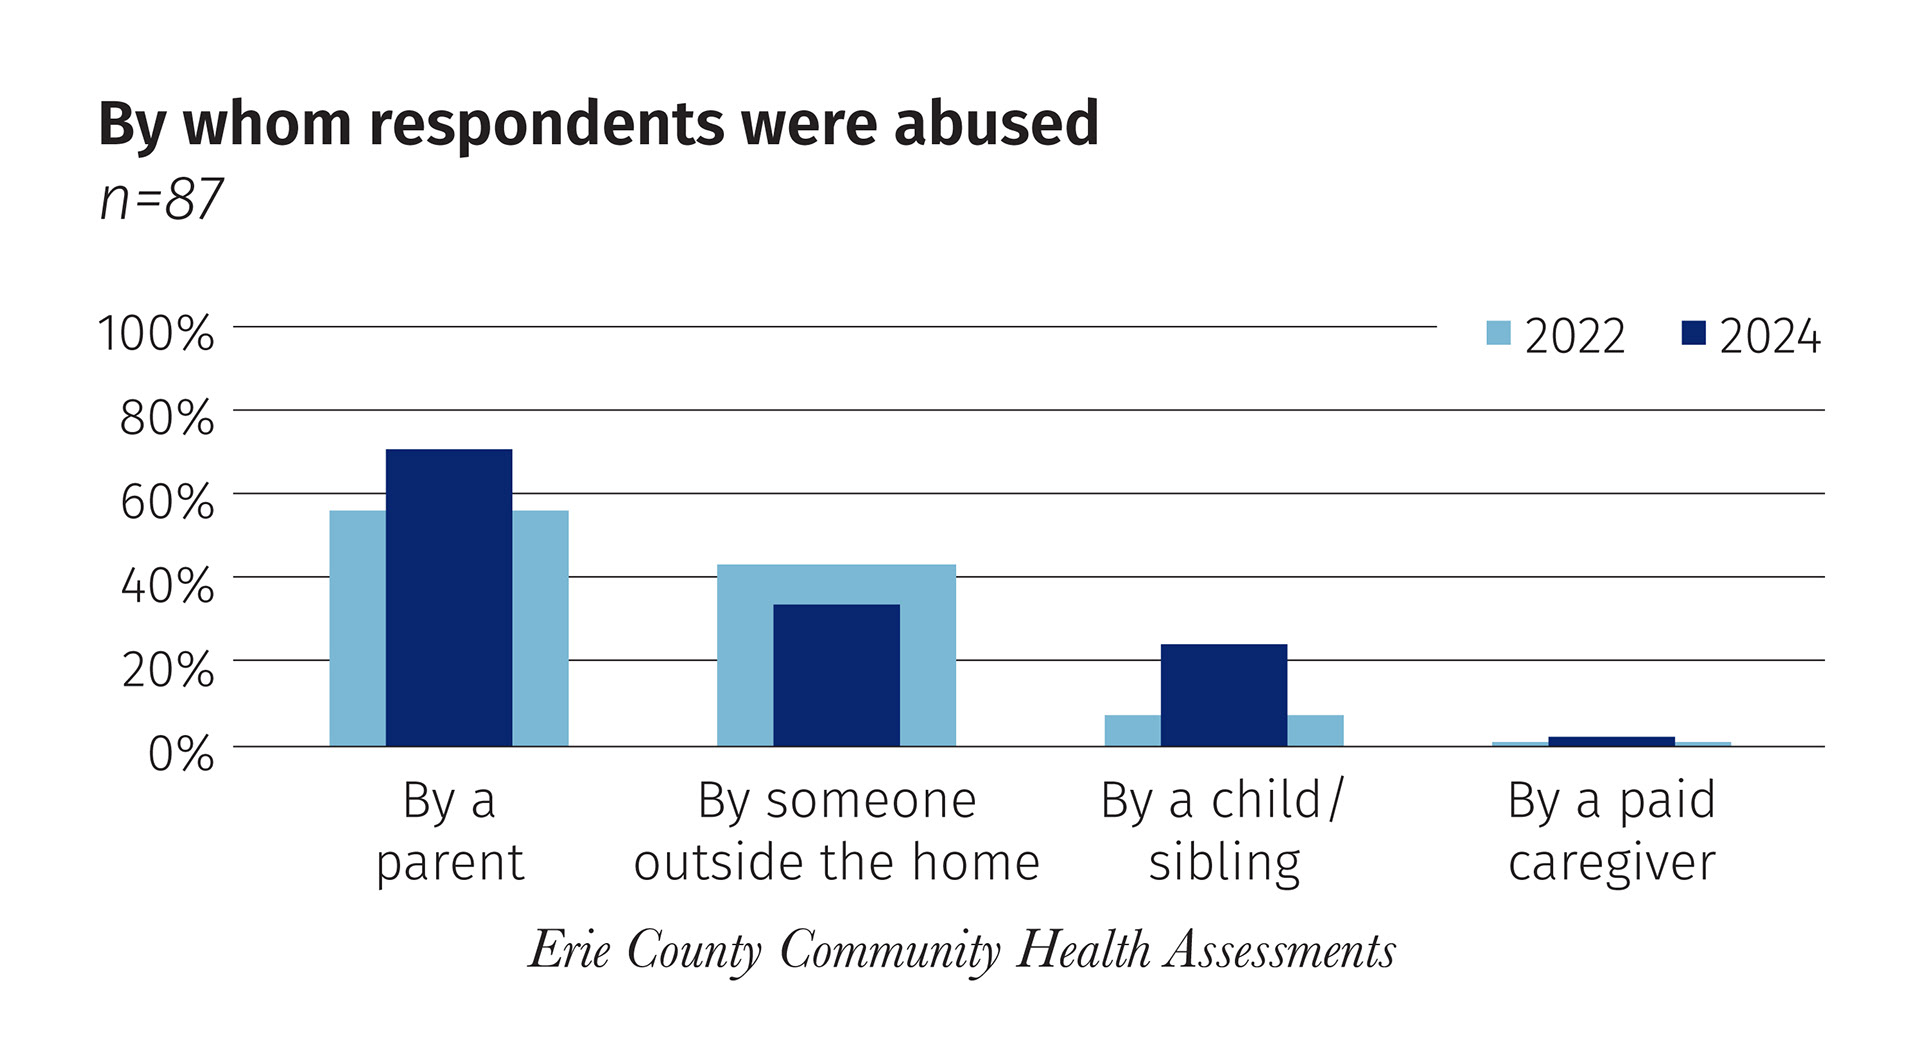
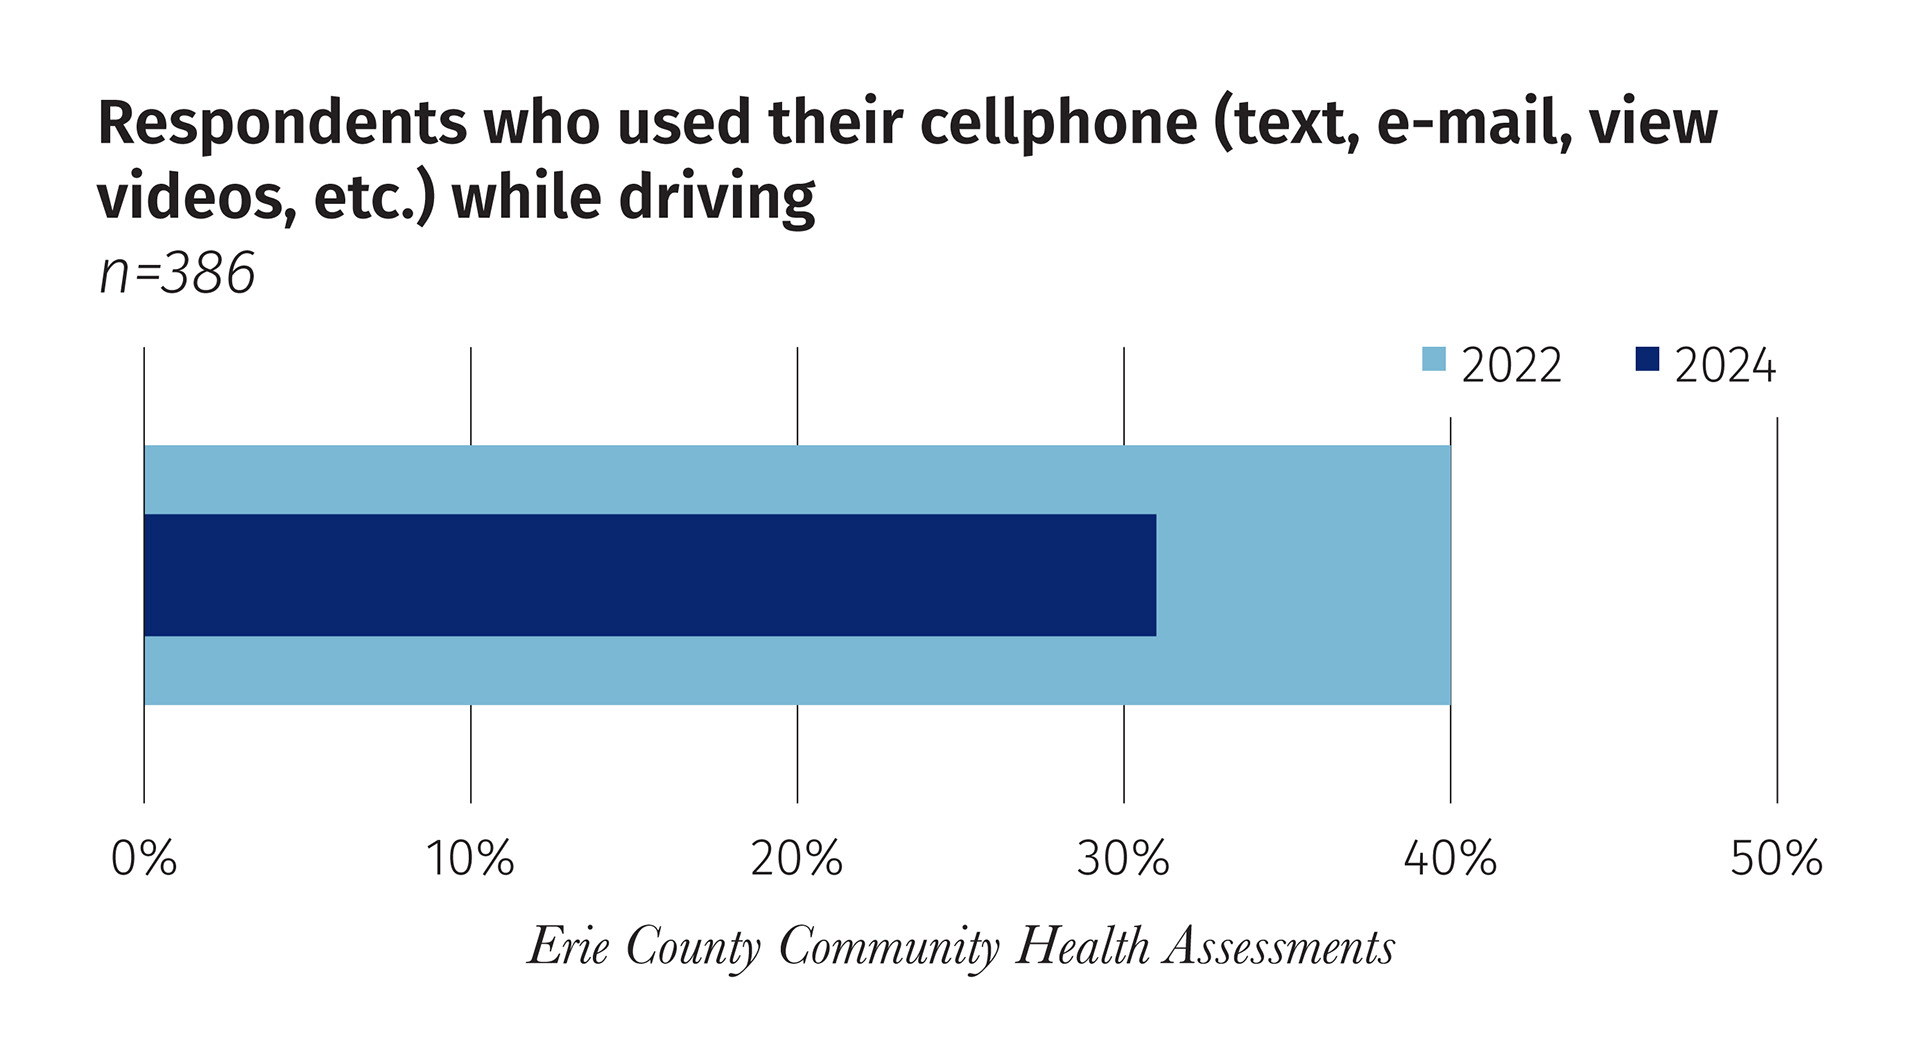
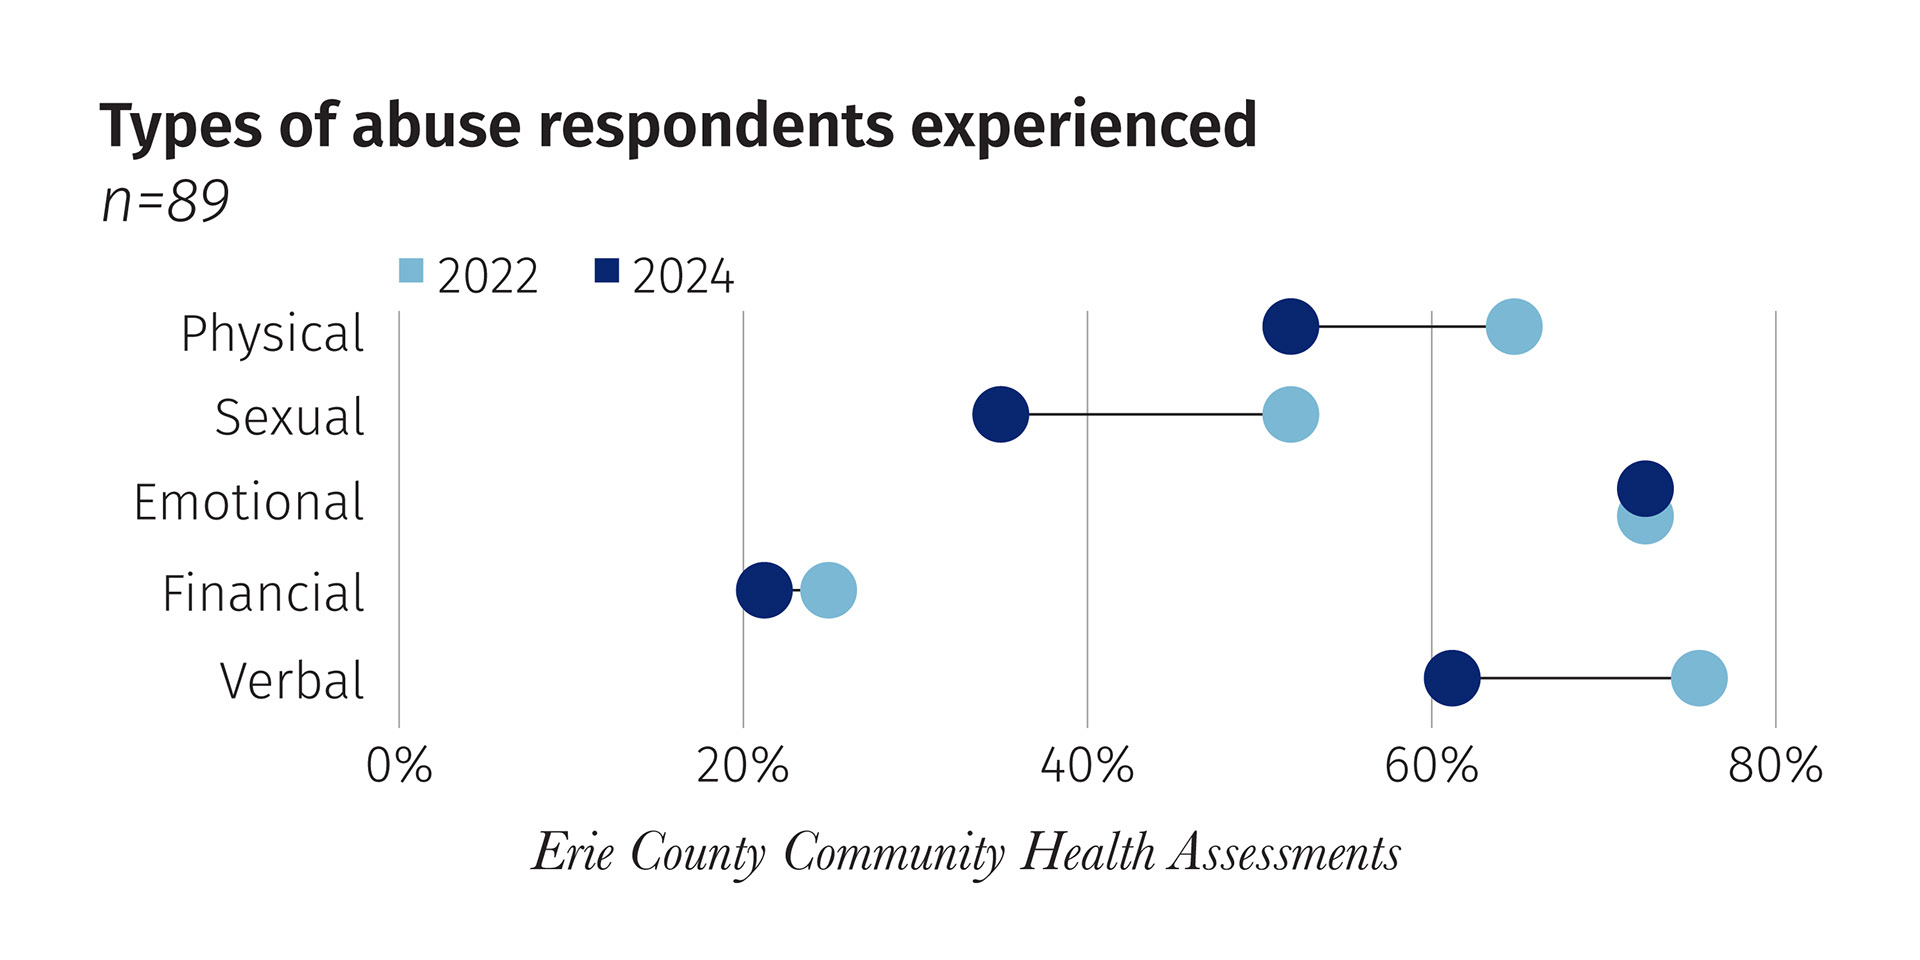
Data visualization was a huge part of this project. The ability to communicate large sets of health data into digestible charts and graphs was key. In order to do this clearly and concisely, I created a color system to separate the types of data displayed. Exhaustion from reading the same type of graph multiple times can happen as well, and with little to no narrative included in the report, I had to make sure there was a variety of charts to break up monotony.

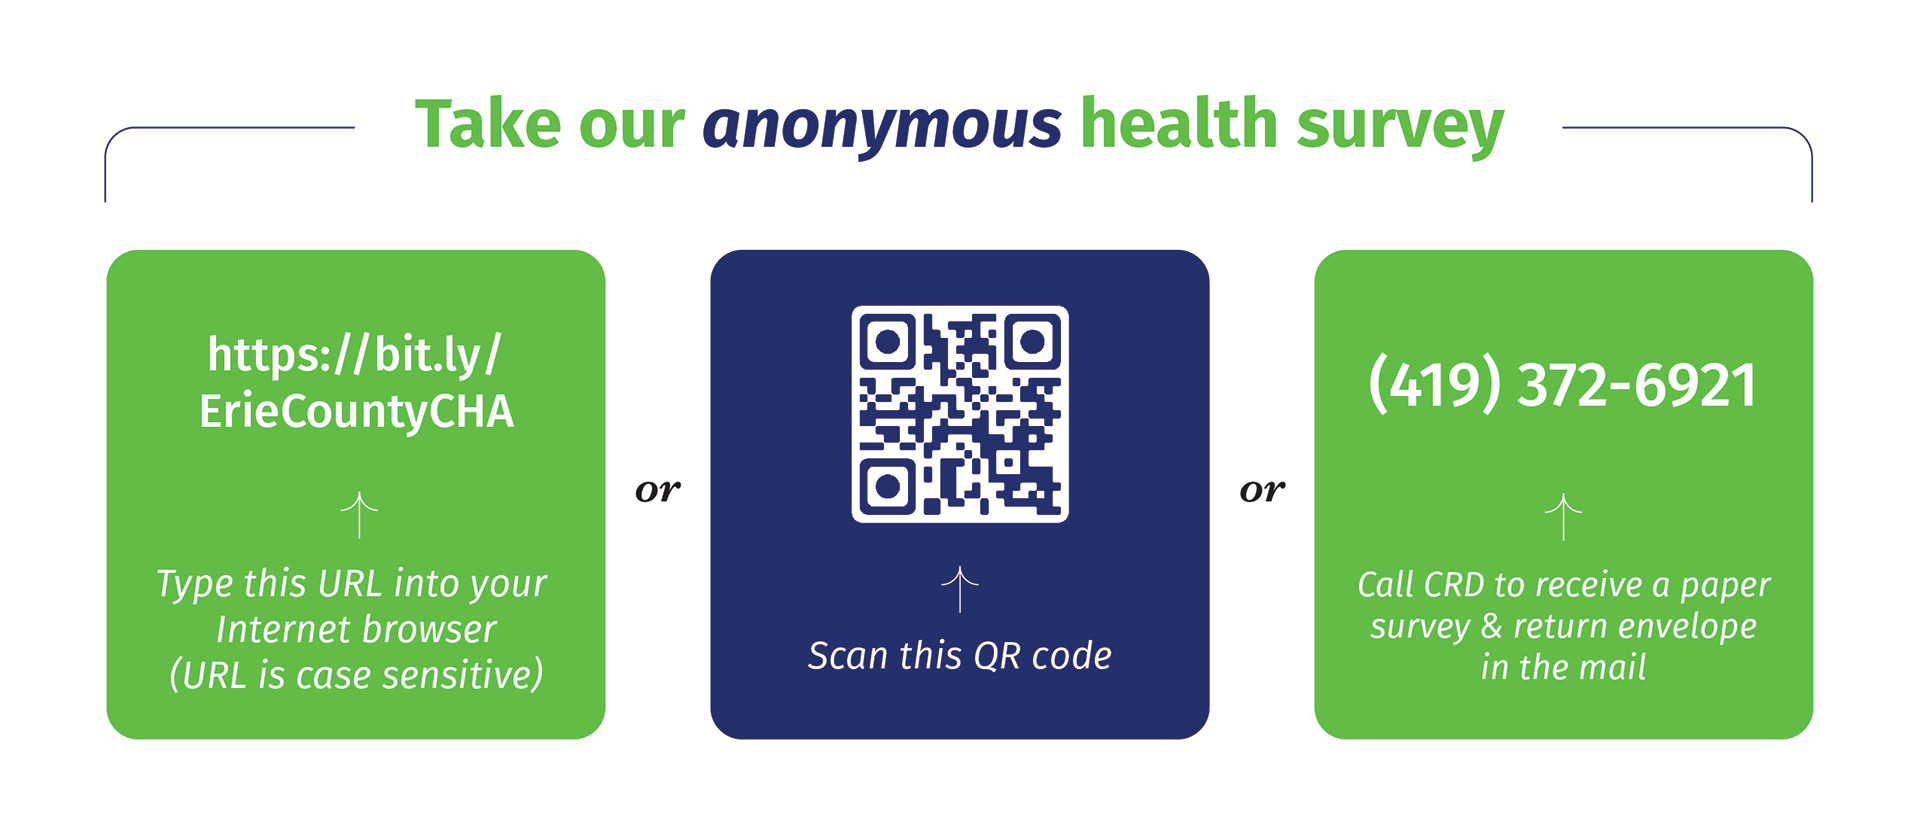
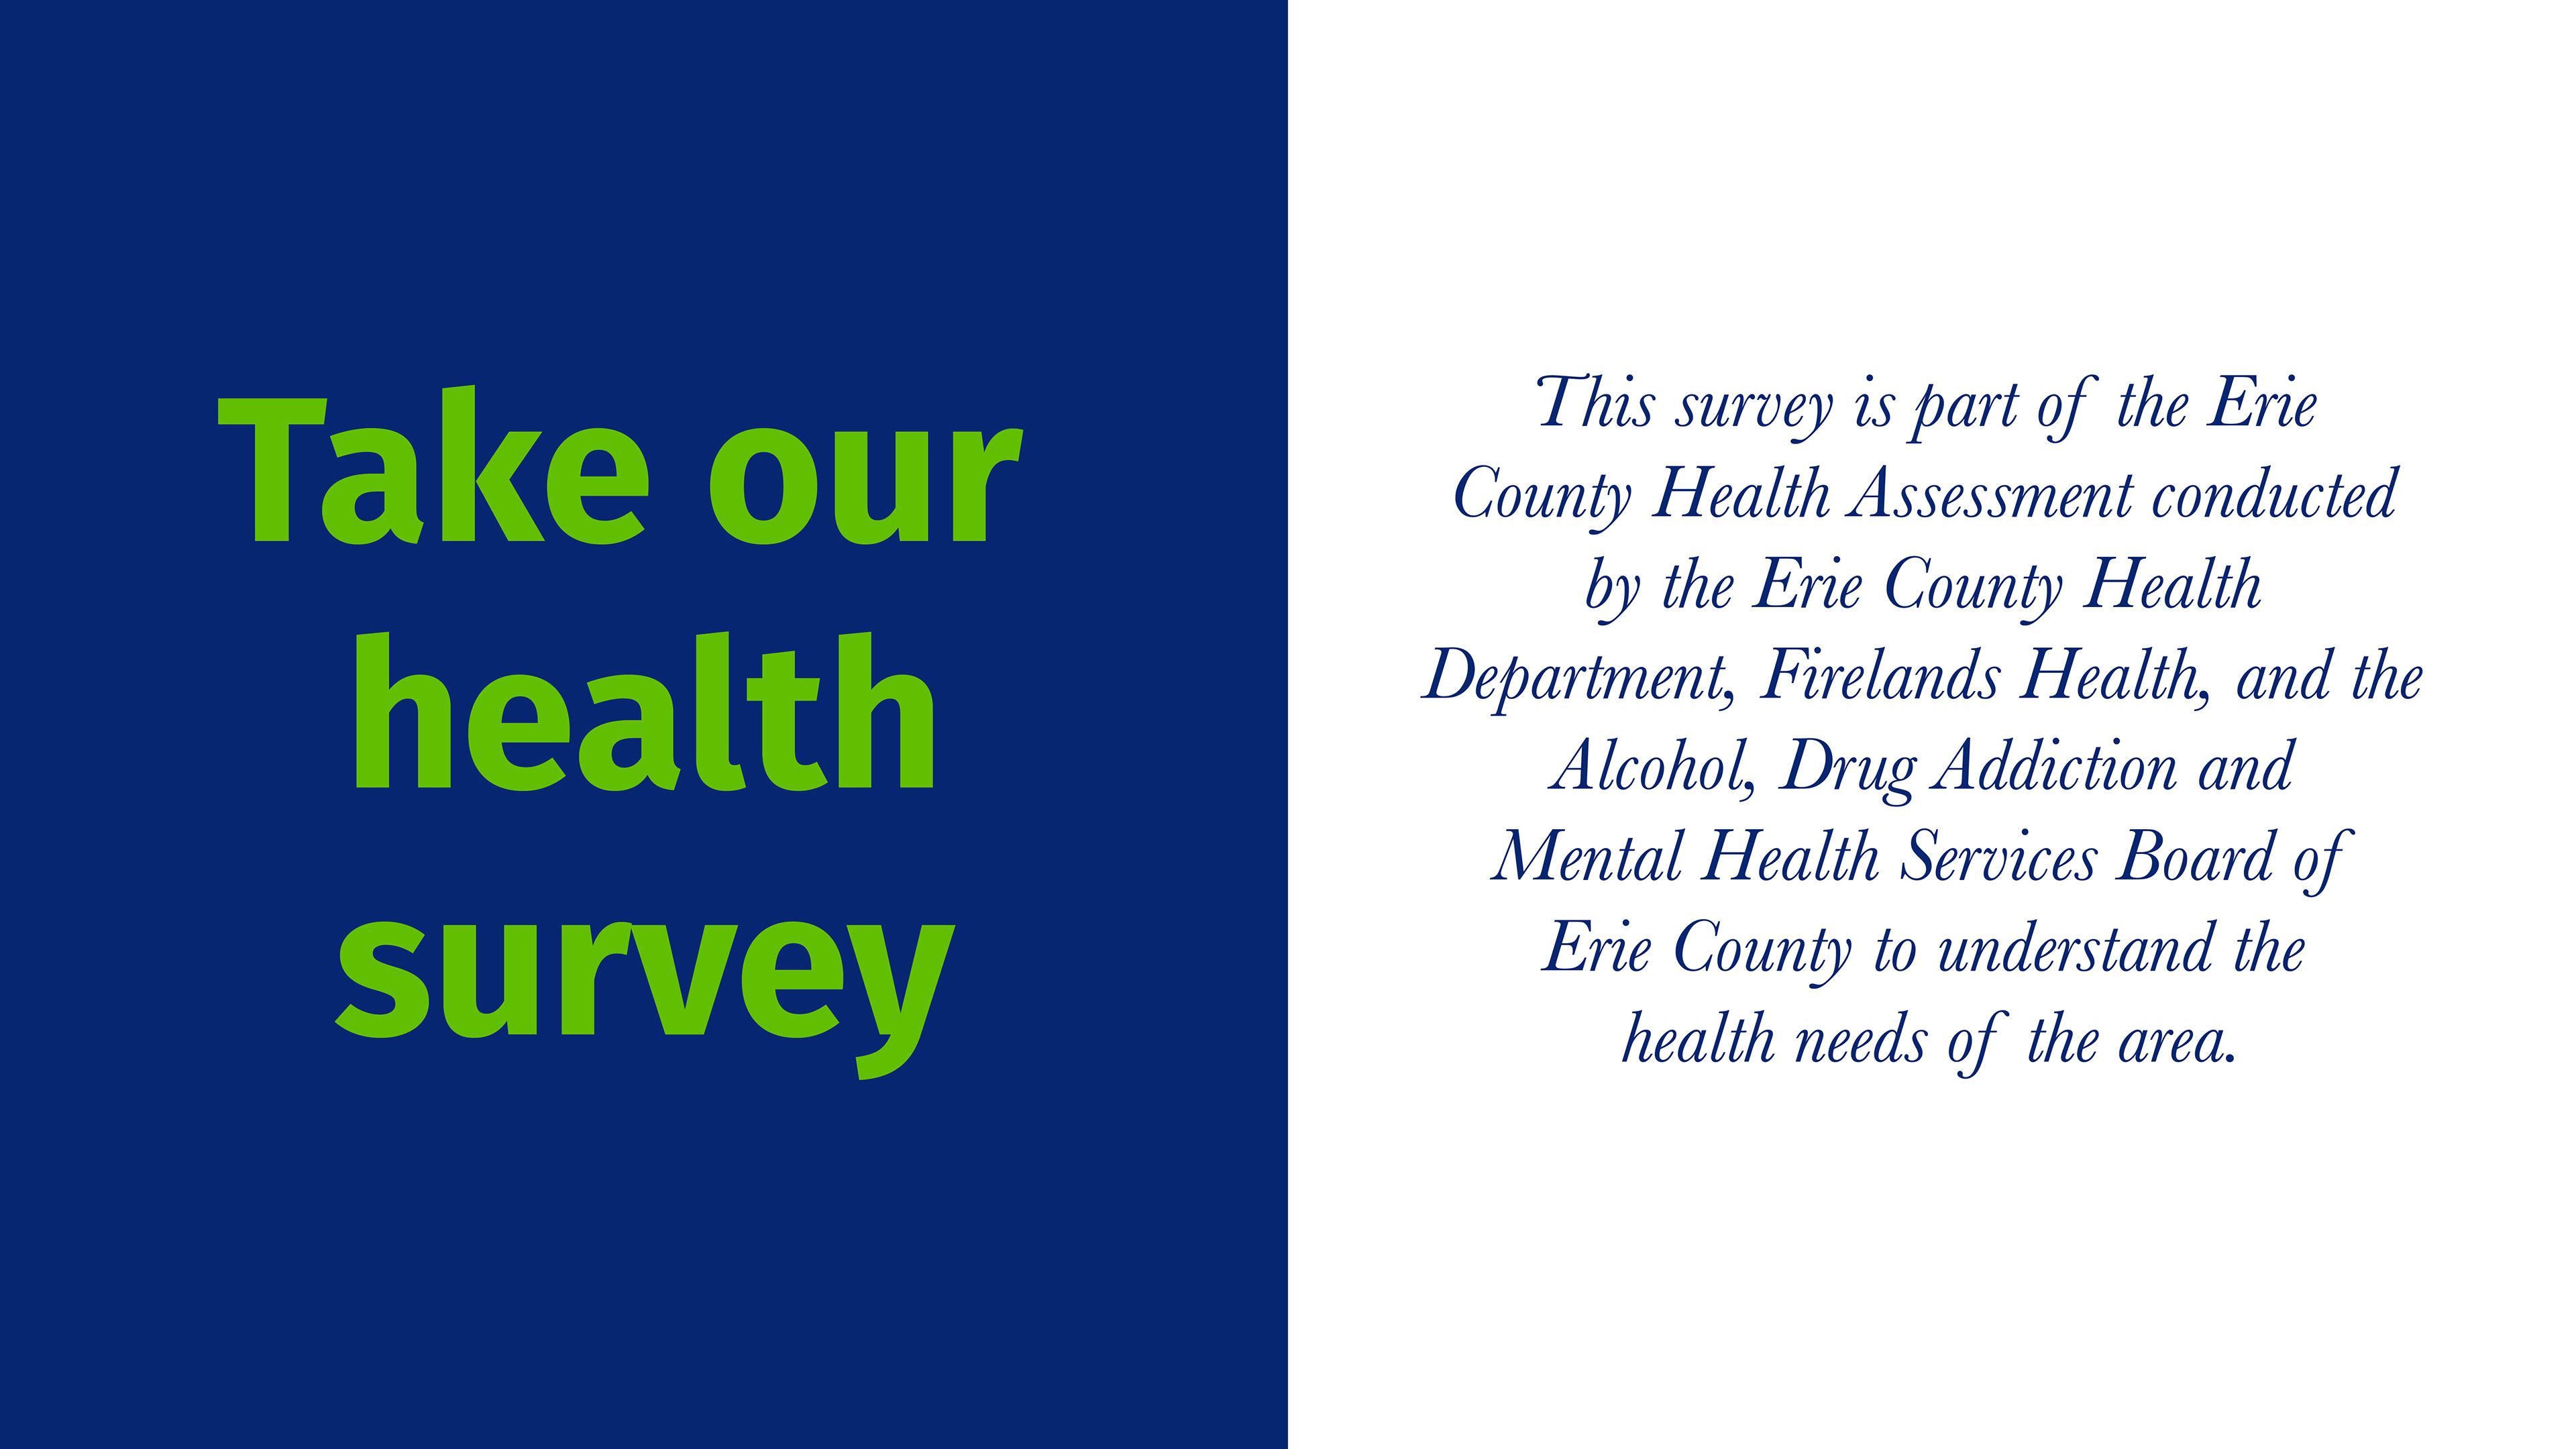
In order to market ourselves and the survey we created to conduct this assessment, I worked closely with the Erie County Health Department to create social media campaigns, digital advertisements, direct mail inserts, email campaigns, and more to ensure a statistically significant survey sample size.
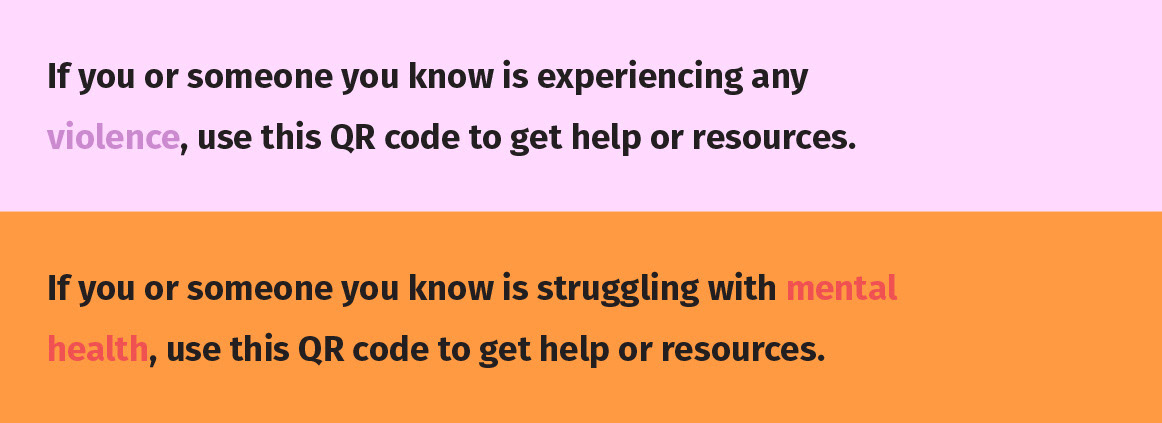
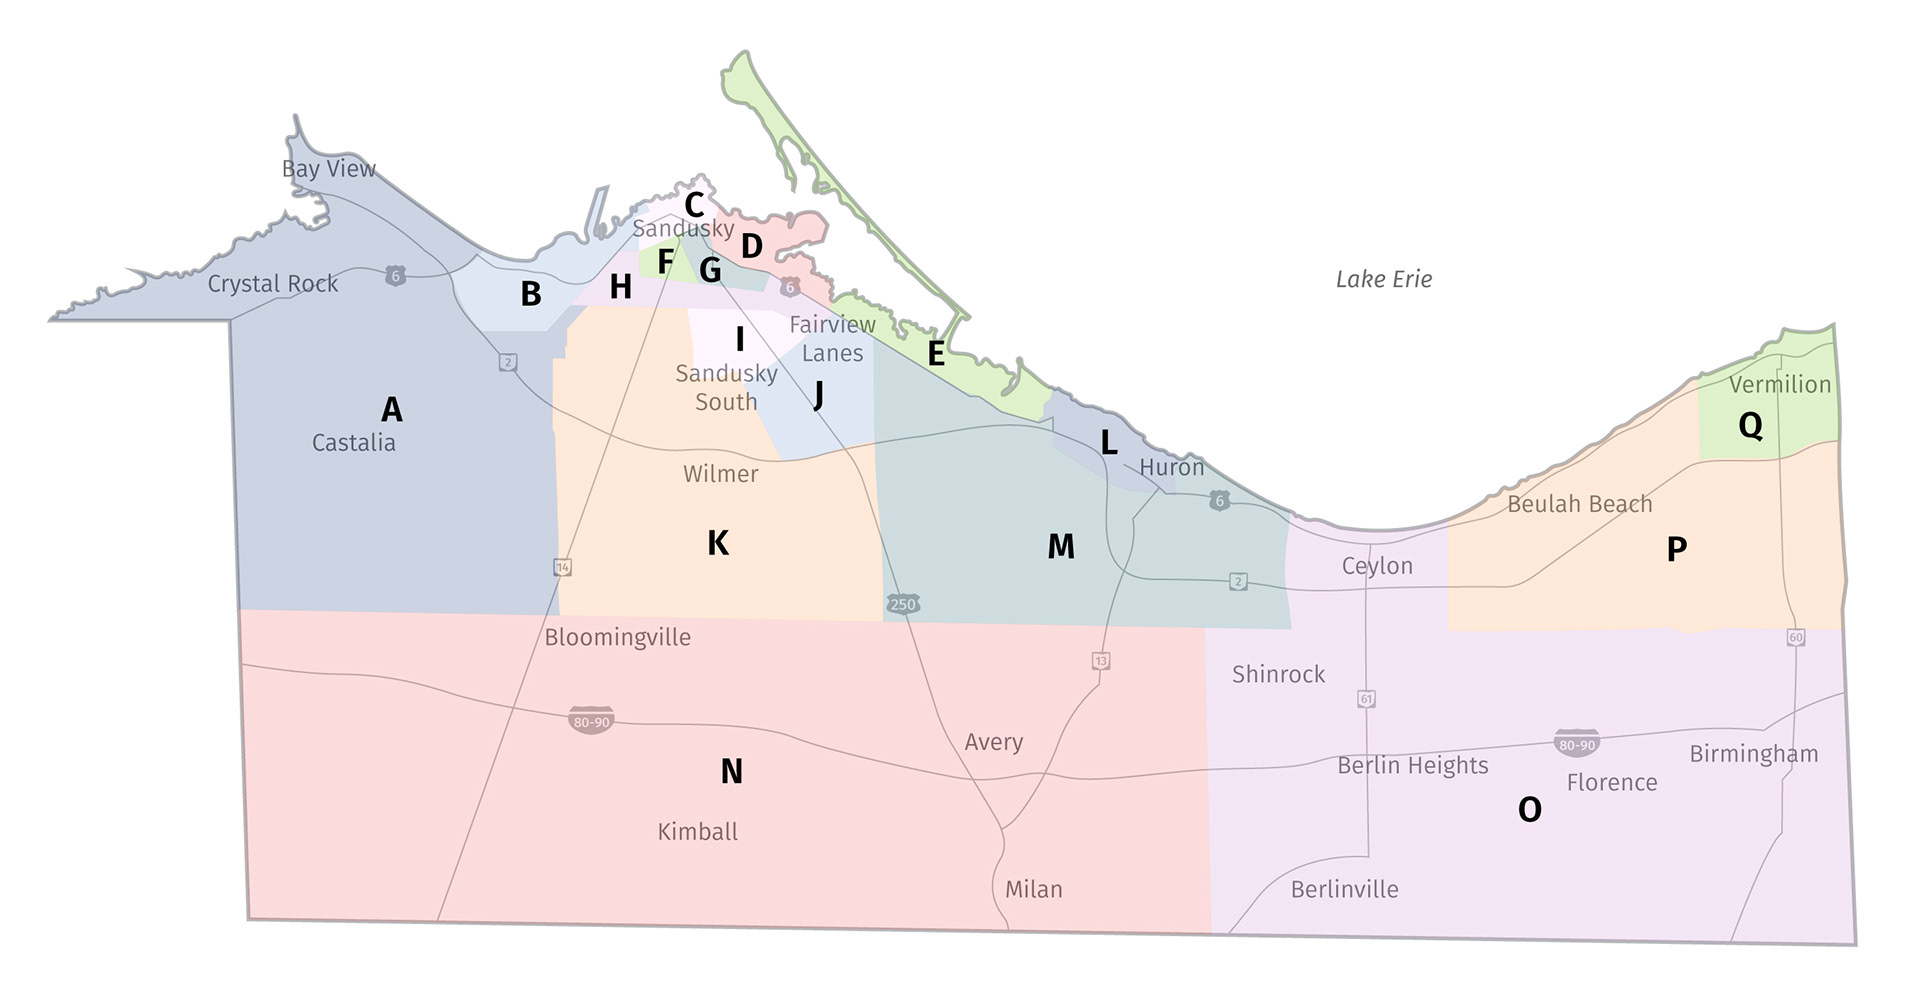
Even ensuring the survey itself was clear and digestible was best suited by design work. I created a map for respondents to better answer the zip code question. Additionally, making sure those who are experiencing negative public health situations was the main point of this endeavor. I created a final page on the survey for services and resources those who are having these negative experiences can access in real time.